This case study demonstrated that the built-in CFD module of
TurboTides is a powerful yet easy to use
tool while conducting full 3D performance predictions, optimization and data
reduction for turbomachine design. It was used in Spinpo webinar July, 2025. The
High Efficiency Centrifugal Compressor (HECC) case used comes from NASA. This case
study is not intended to be a CFD benchmark validation study currently.
Instead, we set up and execute these CFD exercises close to design iteration in
real life. Therefore, relatively coarse mesh and common RANS turbulence model
were used. The performance predictions were compared with the test data. A data
reduction exercise then was conducted to calibrate the 1D model within
TurboTide system. TurboTides is a complete turbomachinery design software
package which incorporates 1D, 2D, 3D Geometry, 3D CFD, and 3D FEA tools into a
single software package. This software offers unique workflow and optimization
options that can greatly reduce the time required for turbomachinery
development cycles, improve the quality of the end product, and reduce future
project development time by organizing existing design/experience in the TT
software efficiently. The TurboTides CFD module contains a full 3D Reynolds averaged
Navier-Stokes solver, with automated meshing and setup tools. Within a few
minutes, the module can create a mesh and handle the setup of the model. The
meshing tool supports turbomachinery components of all types, including
impellers, diffusers, volutes, secondary flow paths, and inlet chambers.
Clearance can be modeled, and the CFD module includes multiphase modeling. The High Efficiency Centrifugal Compressor was
produced as a collaboration between NASA and the United Technology Research
Center, with aggressive goals for operation efficiency[i].
This case was chosen as a benchmarking case for two reasons. First, the case
represents a high pressure ratio compressor with advanced aerodynamic design
and mixed diffuser design. Second, flow path and blade coordinates as well as
detailed test data are provided as a part of the source material, cited in
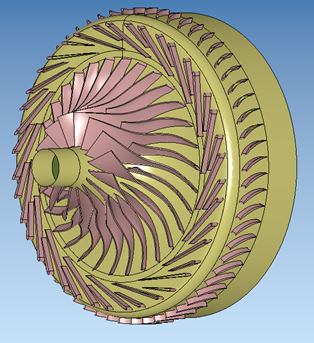
Appendix A. This high pressure ratio compressor stage includes a centrifugal
impeller with splitters, followed by a split radial diffuser. After the
splitters, there is a 90 degree turn in the flow path followed by an axial
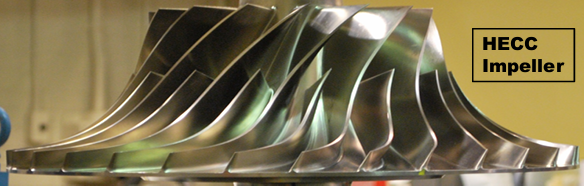
vaned diffuser. This is pictured below in Figure 1. Figure 2 shows the HECC
compressor geometry manufactured for testing. Figure 1. HECC
compressor geometry as imported into TurboTides Figure 2. HECC
impeller[i] A detailed description of the test procedure is provided in
the NASA reference document in Reference.
For both the test setup described in the NASA document as well as the
CFD conducted in TurboTides, the inlet total pressure was 1.01 bar, with an
inlet total temperature of 15C. The working fluid was air. The operating
condition is 5kg/s at 21786 RPM. The HECC stage was rebuilt by importing geometry
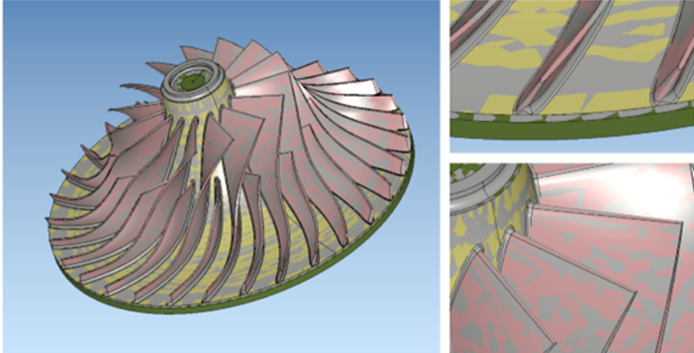
coordinates provided in Medic et al[ii]
into TurboTides using the 'Import from cross-sections' tool in the Geometry
Module. The geometry was overlaid onto the parametric model imported into
TurboTides to visually confirm the model's accuracy. This is pictured below in
Figure 3. Figure 3: 3D CAD
overlay with parametric geometry model recreated in TurboTides A performance map prediction for the HECC design was completed
using the TurboTides built-in CFD module. TurboTides design system includes a
full-featured CFD tool with automatic meshing with secondary flow paths,
parallel processing, robust features and post-processing. It has options for
interfacing with external CFD tools like CFX/Fluent, Star CCM, FineTurbo, etc.
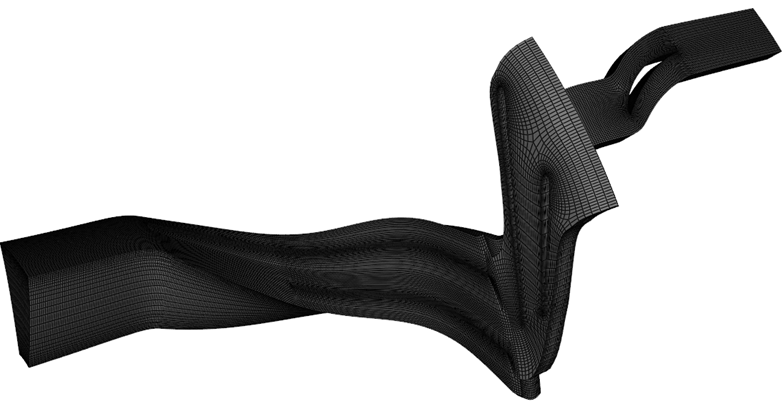
for users' convenience. The TurboTides automated mesher integrated into the CFD module
was used to produce a mesh with 1,109,024 cells. The mesh included the clearance region but not
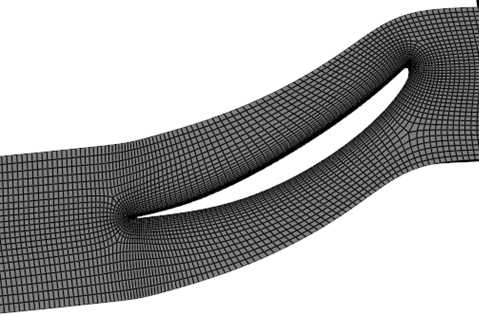
the. Figures 4 through 8 show the mesh used for this study. It is relatively
coarse, however, its size is well aligned with the every day design environment
where engineers use similar quality meshes for quick design iterations. High
fidelity CFD using finer meshes may be used in the later design phases to
improve the accuracy, but it's out of scope of this case study at this time. Figure 4. Complete
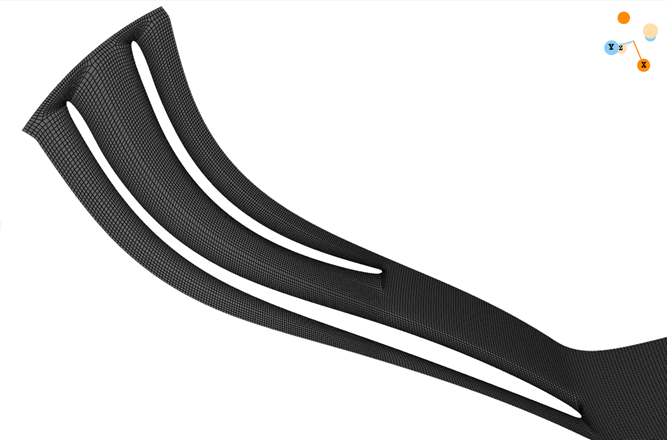
stage mesh in the TurboTides CFD module Figure 5. Impeller mesh
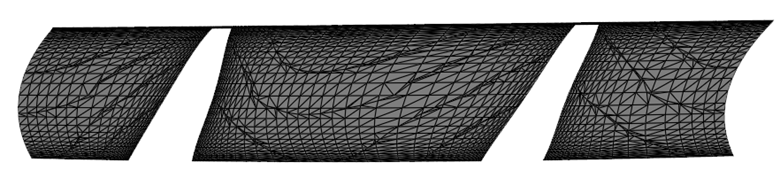
at 50% span surface Figure 6. Impeller mesh
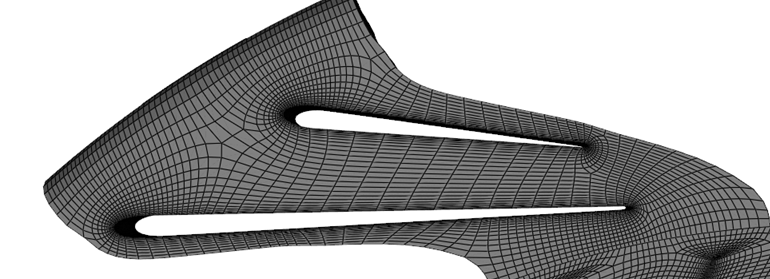
at 95% meridional distance through impeller Figure 7. Split
diffuser mesh Figure 8. Axial vaned
diffuser mesh The meshing tools in the CFD module include a mesh quality
report. The reported minimum aspect ratio was 0.00216, minimum orthogonal
quality was .142, and the minimum skew quality was 0.0839. The K-epsilon turbulence model was used for these CFD
simulations. At the design point, the RPM is 21786, and the total to static
pressure ratio was 4.4. Figure 9 below shows the prediction of total-total pressure
ratio from the TurboTides CFD module compared with the test data provided, and Figure
10 shows the comparison of the total isentropic efficiency. Figure 9. Performance
map of mass flow rate vs pressure ratio for TT CFD with overlaid HECC test data
Objective /Background
TT CFD setup
Results and Discussion
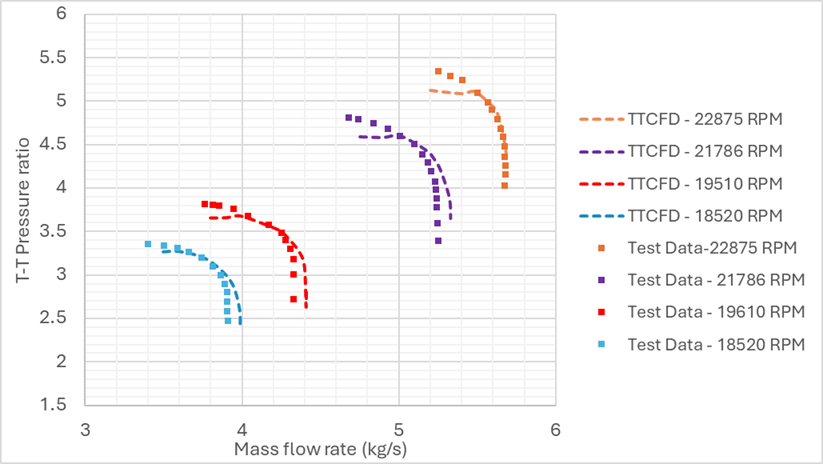
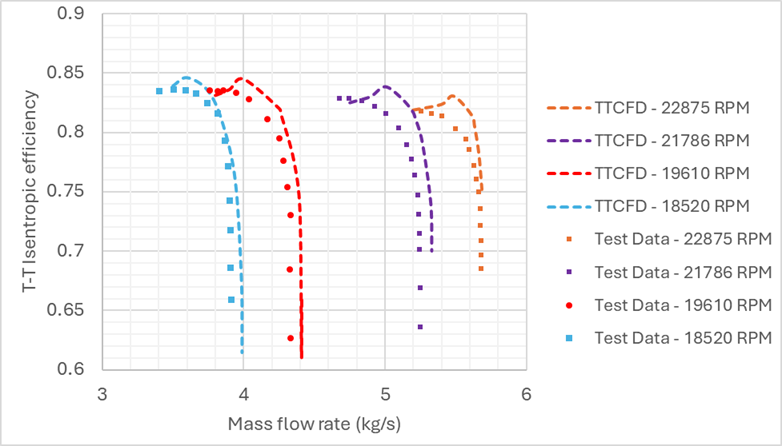
Figure 10. TT CFD total to total efficiency map compared with HECC test data
The performance prediction shows relatively good agreement for both the pressure ratio and efficiency plots. At the lower speed lines as well as at the design point, the prediction of pressure ratio is nearly identical.
The post-processing options allow for line plots as well as contour, vector and streamline plots to be produced. The user can define custom surfaces on which to project the contours. Below in Figure 11 a contour of relative Mach number shown at the 50% span. Figure 12 shows a line plot displaying the relative velocity magnitude at varying spans from 20 to 80%. For both figures, the RPM was 21786, with a T-S pressure ratio of 4.5.
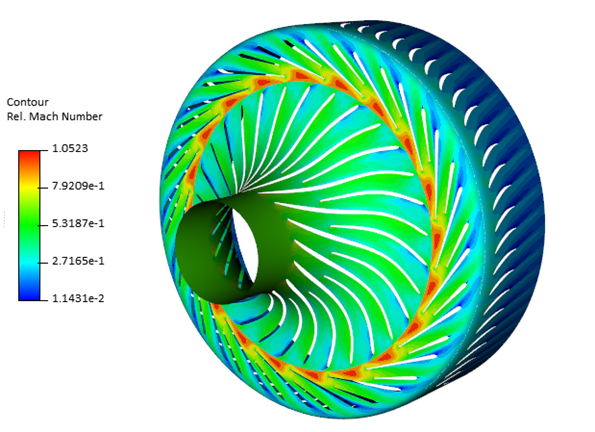
Figure 11. Relative Mach number contour plot at 50% span (21786 RPM, 4.5 T-S pressure ratio)
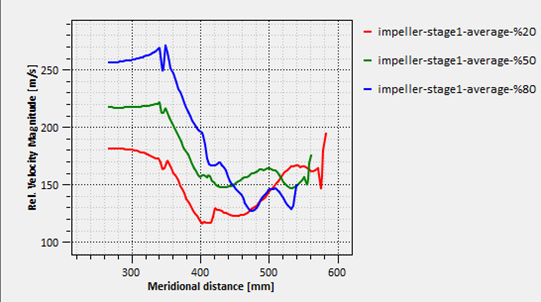
Figure 12. Line plot of relative velocity magnitude for flow through impeller for 20, 50, and 80% span (21786 RPM, 4.5 T-S pressure ratio)
3D iso contours were created at this operating condition to visualize the flow field of impeller. The colormap was set to have Mach number up to 1, a small region of supersonic flow near impeller LE tip is observed, but it's well confined, which may explain in part the good performance of this compressor design.
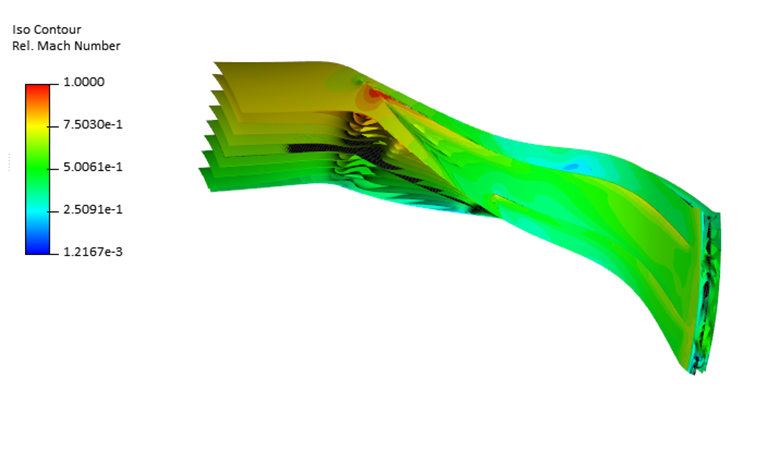
Figure 13. Relative Mach number distribution in impeller flow field. (21786 RPM, Prts=4.5)
1D modeling and Data Reduction
After completing the CFD simulations, the results were used to calibrate the 1D modeling in TurboTides. Using this advanced Data Reduction feature, TurboTides users can bring the accuracy of CFD simulation to 1D. With a calibrated model, the user can make changes to the design or operating condition and quickly evaluate the effects of those changes without having to do any CFD or additional testing. It�s a real timesaver and can be very powerful for fast performance prediction.
The Data Reduction process changes the loss coefficients such that the 1d model matches with the CFD or test data results. The data is matched point by point by applying an offset function to the default loss, deviation, and blockage models. TurboTides then uses that offset function to extrapolate and predict performance where there is no available test data. With that, the user now has model which can predict performance with high accuracy. So instead of running many CFD simulations to see how your designs would perform with different fluids and operating conditions, A calibrated 1D analytical model can accurately predict performance in a few seconds even after changing the fluid type or geometry.
The exported result file from TurboTides CFD was brought to
the 1D module, and the Data Reduction solver was run. After the Data Reduction
solver converged, a performance prediction was produced which included a speed
line not in the original test data. In this way, the user can reduce the number
of speedlines necessary for accurate performance prediction, saving time in the
analysis process.
Figure 14 below shows the performance map prediction for the calibrated 1D model, compared to the test data. The 20200 RPM speedline was not run in the CFD simulations, this demonstrates how the calibrated 1D model can be used to accurately interpolate performance at speedlines outside the original performance map.
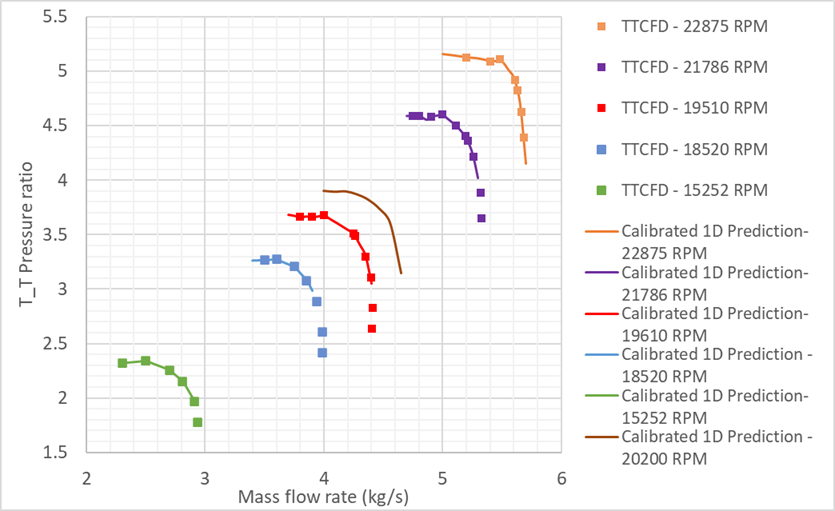
Figure 14. Pressure ratio vs mass flow rate performance map for 1D calibrated model compared to CFD data
Conclusion
This case study demonstrates the capability of TurboTides for modeling and predicting performance of modern high-performance compressors. The comparison between TT CFD and NASA HECC test data shows reasonably good agreement using coarse mesh. We may prepare high fidelity CFD studies on this case in the future. The TurboTides CFD is a fast, accurate, easy to use, and cost-effective tool for everyday design activities. The combined capability of the geometry, 1D, 2D, and 3D CFD modeling tools make TurboTides one of the best choices for reducing the time and effort required for development cycles.
Reference
[i] Edward P. Braunscheidel, Gerard E. Welch, Gary J. Skoch, Gorazd Medic and Om P. Sharma, Aerodynamic Performance of a Compact, High Work-Factor Centrifugal Compressor at the Stage and Subcomponent Level 50th Joint Propulsion Conference, July 2014.
[ii] Gorazd Medic, Om P. Sharma, Joo Jongwook, Larry W. Hardin, Duane C. McCormick, William T. Cousins, Elizabeth A. Lurie, Aamir Shabbir, Brian M. Holley, and Paul R. Van Slooten., High Efficiency Centrufugal Compressor for Rotorcraft Applications NASA/CR-2014-218114/REV1, October 2017.
Please contact us if you have any questions or would like to schedule a live demonstration.